


Content table
Summary
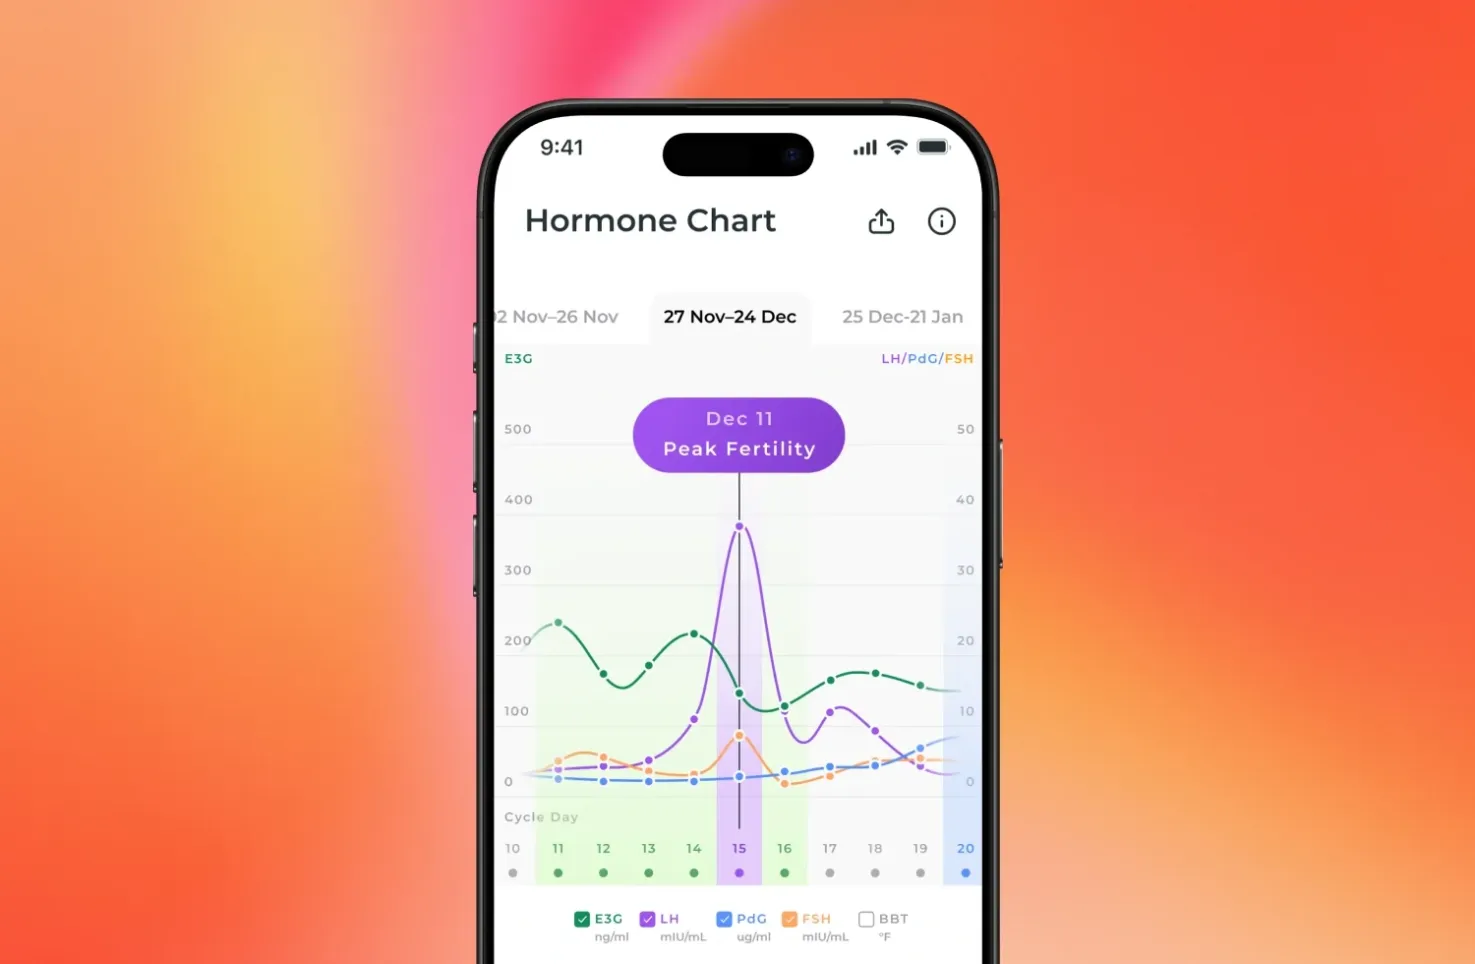
Your Inito hormone chart tracks four key hormones — E3G (estrogen), LH (luteinizing hormone), PdG (a urine metabolite of progesterone), and FSH (follicle-stimulating hormone) — as they change throughout your menstrual cycle. When read together, these four lines show you when your body enters the fertile window, when it’s gearing up to ovulate, and whether ovulation actually happened. The chart is color-coded and updates every time you test.
Introduction
The first time you open the Inito app after testing with the InSight Wireless Reader™ (variant of the Inito Fertility Monitor), you’ll see a chart filled with colored lines and numbers.
You don’t need to decode every detail. A handful of simple patterns tell you almost everything you need to know about where you are in your cycle. In simple terms, reading your Inito chart means looking at when estrogen rises, when LH peaks, and whether PdG confirms ovulation.
This guide covers what those lines and labels mean, how to spot your fertile window, and how to tell whether ovulation has been confirmed — without getting lost in the data.
Inito works on both iOS and Android, so you can follow along on whichever device you use.
If you’re past the basics and want to interpret specific chart patterns — including plateau surges, biphasic LH, and anovulatory cycles — read our detailed guide on real Inito chart patterns and examples.
What Does My Inito Chart Show?

Your Inito chart shows how your hormone levels change day by day across your cycle. Each test adds a new data point, helping you track patterns over time.
Your chart has two simple parts:
- The horizontal line (X-axis) shows your cycle days (CD 1, CD 2, and so on)
- The vertical lines (Y-axis) show your hormone values on those days
In simple terms:
- The X-axis tells you when something is happening
- The Y-axis tells you what your hormone levels are on that day
The four hormone lines, at a glance:
| Hormone | Color in App | The short version |
| E3G (estrogen) | Green | Climbs in the days leading up to ovulation — your earliest heads-up that fertile days are near |
| LH (luteinizing hormone) | Purple | Spikes to kick off egg release |
| PdG (urine metabolite of progesterone) | Blue | Rises gradually after the egg is released — the confirmation signal |
| FSH (follicle-stimulating hormone) | Orange | Most active early in the cycle, helping follicles develop |
Can’t remember which color is which? The legend in the top-right corner of the app has you covered.
Three Patterns That Tell You (Almost) Everything
Most of what you need to know comes down to three patterns:
- A climbing green line = fertile days ahead
E3G tends to increase several days before egg release, often before LH shows any activity. This early signal is exactly what LH-only strips miss, which is why multi-hormone tracking catches a wider window. - A sharp purple spike = egg release is imminent
The LH spike is your body’s internal “go” signal to the ovary. One thing worth knowing: there’s no universal “normal” level for this spike. LH surge levels can vary widely from person to person, which is why Inito looks at your personal pattern instead of relying on a single universal cutoff. - A steadily climbing blue line afterward = ovulation happened
PdG doesn’t jump — it increases steadily. Inito waits to see a consistent upward trend over a few days before marking ovulation as confirmed. A single high reading isn’t enough.
That’s the whole framework. If you can spot these three shifts, you can read your chart.
“Before using Inito, I was tracking my BBT and using cheap ovulation strips. It worked to an extent, but it often left me second-guessing whether I was timing things right. I came across Inito on TikTok and loved how easy it was to track various hormones to successfully identify the peak fertility timeline each cycle. It helped me detect my peak fertility window — something I would’ve completely missed otherwise.”
— Sri Lekha E
Want to see how these patterns show up in real cycles? Read our detailed guide on Inito chart examples. It walks through real-world examples, covering different surge shapes, missed ovulations, and more.
What the Daily Fertility Labels Mean

Each day you test, the app assigns a label that translates your hormone data into plain language:
Low Fertility: Hormone levels haven’t entered the fertile zone (or the window has already closed). Nothing to act on right now, just keep testing.
High Fertility: E3G is on the move. Your body is preparing for ovulation, and the odds of conception are increasing. If you’re trying, this is a good time to start.
Peak Fertility: LH has spiked. Today is the highest-probability window in your cycle. This is the best time to have sex if you’re trying to conceive.
Ovulation Confirmed: PdG has trended upward over several days after the LH spike, indicating the egg was released. You can stop testing if you prefer; ovulation has been confirmed.
These fertility ratings save you from having to eyeball the chart yourself, and help in understanding the lines behind them.
For a breakdown of what to do on each type of day, see our detailed chart guide.
Why No Two Cycles Look Alike
If you compare this cycle’s chart to last cycle’s, you’ll probably notice differences, and that’s completely expected.
Your E3G might climb more slowly in one cycle. The LH spike might land on a different day. PdG might need an extra day or two before it clearly trends upward. Studies back this up: close to 70% of women see their cycle length shift by up to 6 days, and a clean single-peak LH pattern occurs in under half of all cycles.
Stress, travel, sleep disruption, exercise intensity, illness, dietary changes, coming off hormonal birth control, conditions like PCOS or thyroid imbalances — all of these influence hormone behavior. That’s your biology responding to real life, not a problem with the data.
Know more: Why Does My Period Date Change Every Month?
This is also why comparing across two or three months of charts gives you a much richer understanding of your own baseline than any individual cycle can.
The Science Behind the Numbers
The hormone-based method used by Inito to confirm ovulation has been assessed in peer-reviewed research. Studies published in Nature’s Scientific Reports validated ovulation confirmation at greater than 99% specificity with 92.2% precision. Additional research in Human Reproduction Open (Oxford Academic), indexed by the National Library of Medicine, found a 95% correlation1 between Inito’s urinary hormone measurements and corresponding blood hormone trends.
That pattern-level view is also what makes your chart useful in conversations with a healthcare provider.
Sharing Your Chart With a Healthcare Provider

One of the most practical features of the app is the ability to export your chart — giving your OB-GYN or reproductive endocrinologist actual hormone trend data rather than a verbal summary.
How to do it:
- Open the Inito app → Chart page
- Tap the share icon (top-right, next to the info icon)
- Pick color or black-and-white
- Save or send the PDF directly
Note: you need at least one complete cycle of testing to export.
Doctors can use the exported chart to flag cycle irregularities, identify cycles where ovulation may not have occurred, and decide if bloodwork or imaging would be useful next steps.
The Inito platform has been part of more than 40,000 pregnancy journeys and is used by upward of 200,000 couples. The underlying technology is protected by over 20 patents.
Stories from Inito Users
“Prior to Inito, I had a hard time pinpointing my actual fertile window. Using regular OPK strips, I would get a week of high readings, leaving me confused about when my actual peak day and ovulation were occurring. Once I started using Inito, I could clearly see my high fertility days and a definite peak day before ovulation. When I got my postpartum period back at 3 months, I used Inito again and conceived my second healthy rainbow baby the very next month!”
— Andjela Dragojevic
“What stood out to me was that Inito measures four different hormones: Estrogen, LH, PdG, and FSH. That was a game changer for me. Inito helped me uncover that I was having several anovulatory cycles. Eventually, I decided to see a reproductive endocrinologist. She was genuinely intrigued by my Inito charts. Inito gave me the clarity and confidence to seek help sooner.”
— Amanda Burghauser

FAQs
Look for the blue-shaded region labelled “PdG rise.” In the calendar view, the relevant date appears in blue with a “PdG risen” tag. The app bases this on a multi-day upward PdG trend following an LH spike — not on any single reading.
Your body initiated the ovulation process, but a consistent PdG climb didn’t follow — which may point to a cycle where ovulation didn’t complete. One or two such cycles per year is within the normal range. If it happens in three or more consecutive cycles, it’s worth discussing with your doctor.
A High Fertility day means estrogen is climbing and you’ve entered your fertile window — typically a few days out from ovulation. A Peak Fertility day means LH has spiked and egg release is likely within the next day or so. High days widen the window; Peak days pinpoint the last two days of it.
Because hormone levels differ enormously between individuals — and even between your own cycles. Inito personalizes its readings to your data rather than benchmarking against a population average.
Our detailed guide explains why cycles vary, with sample charts illustrating different LH surge shapes and timelines.
Yes — and it’s especially useful in those cases. By measuring four hormones, Inito can surface your actual fertile window and flag cycles where ovulation didn’t occur, even when patterns don’t follow a textbook timeline. The system’s AI draws on over 40 million data points spanning a wide range of cycle types.
Published studies in Nature’s Scientific Reports Journal found a 95% correlation1 between Inito’s urine-based hormone measurements and the trends seen in blood tests. Ovulation confirmation was validated at above 99% specificity (as per studies published in Nature’s Scientific Reports Journal). That said, Inito is a hormone-tracking tool, not a diagnostic device, and results should be interpreted alongside medical guidance for clinical decisions.
Yes. Use the share function on the Chart page to generate a PDF with all four hormone readings across the cycle. Your provider can use it to review trends and inform next steps.
Disclaimer: 1 – Accuracy may be reduced in irregular cycles, anovulatory cycles, or when hormone levels are affected by medical conditions, medications, or inconsistent testing. “95% accuracy to corresponding blood hormone trends” refers to published findings showing that Inito’s urinary hormone measurements closely matched the direction and pattern of corresponding serum hormone changes over time. It does not mean urine values are identical to blood values or that absolute urine and blood hormone numbers will match exactly.


