


Your chart makes complete sense once you know what each colored line stands for:
Hormone | Color |
Estrogen | Green |
LH | Purple |
PdG | Blue |
FSH | Orange |
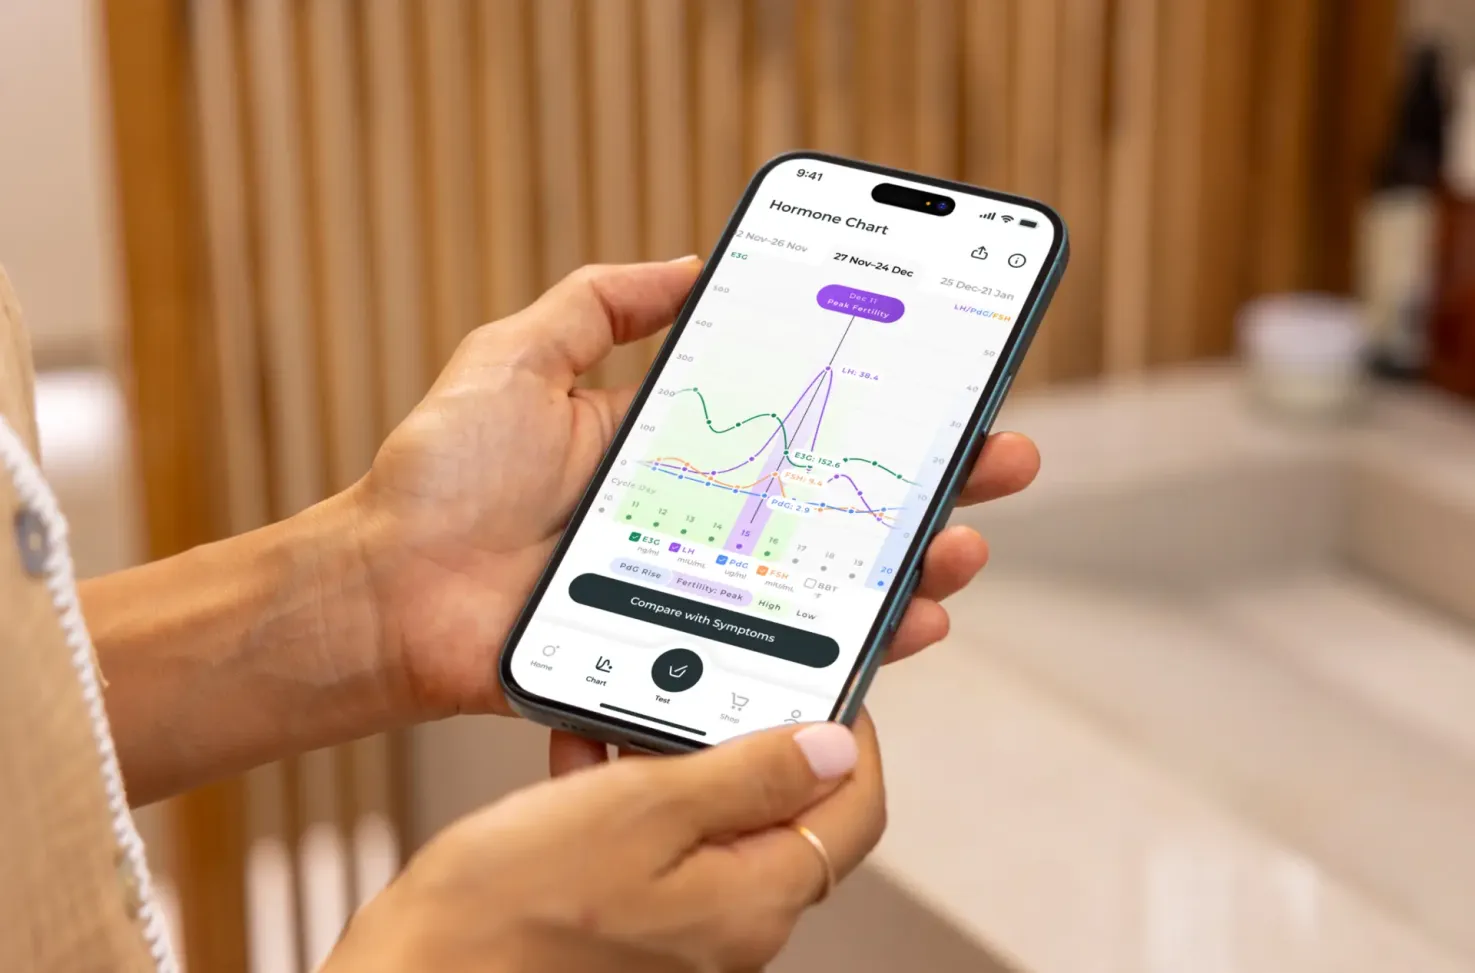
Pro-tip: You don’t need to commit this to memory – look at the top right corner of your screen to know which color indicates which hormone!
Let’s quickly walk through how each hormone typically behaves:
- E3G (Estrogen):
This hormone begins to rise about 3-4 days before ovulation. It’s one of the earliest signs that your body is entering the fertile window, the phase when you’re most likely to conceive. - LH (Luteinizing Hormone):
LH surges about 24–36 hours before ovulation. Think of it as the “go” signal that tells the ovary to release the egg. - PdG (a urine metabolite of progesterone):
PdG increases after ovulation. When you see a steady and consistent rise over several days after your LH surge, it indicates that ovulation truly happened. - FSH (Follicle Stimulating Hormone):
FSH helps kick-start each new cycle by supporting follicle growth in the ovary and selecting the dominant follicle for ovulation.
By measuring all four of these hormones in your urine, Inito gives you a complete picture of what’s happening throughout your cycle, from identifying your fertile window to confirming ovulation, all through a single test strip daily.

Next, let’s get into how the chart itself is laid out. Each graph typically has an X-axis (aka the horizontal line at the bottom) and a Y-axis (the vertical axis on either side). Your Inito chart has an X-axis, and two Y-axes – one on the left, and the other on the right.
Axis | What it indicates |
X-axis | This shows which day of your cycle you’re on. For reference, the first day of your period is marked as the first day of your cycle (aka Cycle day 1 or CD 1), the second day is marked as CD 2, and so on. |
Left Y-axis | Indicates your E3G hormone values and your BBT (basal body temperature)* |
Right Y-axis | Indicates LH, PdG, and FSH values (think ‘everything except E3G’) |
*While Inito does not measure BBT, you can still input your readings to track temperature patterns with your cycle data.
Look at it this way:
- The X-axis tells you when something is happening.
- The Y-axis tells you what your hormone values are on that day.
If you want to see the exact hormone values for a specific day, simply tap on that day in the chart.
Once you know where everything sits, reading the chart becomes much easier.
Note: Your Cycle Day (CD) is different from the calendar date. As we discussed above, the numbers along the X-axis represent your Cycle Day, not the day of the month. To see the actual date, tap on any specific day in your chart; the corresponding calendar date will appear. For example, in the chart above, December 4th corresponds to Cycle Day 8.
You’ll also see fertility ratings on your chart. These labels help you understand your best days to try to conceive.
High Fertility (Green)

You’re in your fertile window, and your chances of conceiving on this day are high.
What it means: Estrogen is rising, and your body is preparing to ovulate within the next few days.
What to do: If you’re trying to conceive, this is a good time to start having sex regularly – every day or every other day works well. Since sperm can survive for up to 5 days, starting now improves your chances of conceiving.
Know more: Fertility Tips for Men and Women on the TTC Journey
Peak Fertility (Purple)
This is your most fertile day. Your chances of conceiving are at their highest!
What it means: Your LH is surging, which usually means ovulation should occur within the next 24–36 hours.
What to do: This is the best time to try if you’re hoping to get pregnant.
Know more: When to Have Sex After LH Surge: Your Complete Guide
Low Fertility
The most common reading outside your fertile window. This means that the chances of conceiving on this particular day are low.
Know more: Getting Pregnant: When Are You Most Fertile?
What it means:
- Before ovulation: Estrogen and LH are still low, which means your body has yet to release the egg. This is before the start of your fertile window, and before ovulation. (Sometimes estrogen may rise without being followed by an LH surge. In that case, you might see several days of High Fertility, then a return to Low Fertility. Be assured, if your LH rises later in the cycle, Inito will catch your surge and you’ll see a Peak Fertility result at that time.)
- After ovulation: Your fertile window has passed since the egg has already released and it survives for only 24 hours. If ovulation has occurred, PdG may now be increasing.
What to do: Just keep tracking! Low Fertility is simply a sign that it’s not your fertile window right now, not that there’s anything wrong with your fertility.
Waiting for PdG Rise
Ovulation isn’t confirmed quite yet.
What it means: Your PdG hasn’t shown a steady and consistent rise from your baseline. Don’t worry, it can sometimes be a while — PdG may take up to 9 days to appear consistently in your urine.
Note: On your chart, this phase will appear as Low Fertility, since the chances of conceiving are low after ovulation.
What to do: Continue testing daily and try not to worry. Everyone’s hormone patterns look a little different. Our internal data found that over half of our users confirm ovulation within 4 days of getting their Peak Fertility. And 98.6% of users got ovulation confirmed within 9 days!
Ovulation Confirmed
Congratulations, ovulation has taken place!
What it means: Your PdG has risen consistently over a few days, confirming that your body released an egg after your LH surge.
What to do: Testing is optional at this point. You can rest assured that ovulation happened. In fact, one study found that Inito is 95% as accurate as blood hormone trends and confirms ovulation with over 99% specificity.
Know more: Your Complete Guide to Surviving the Two Week Wait
Let’s look at a few sample Inito charts and break down what they’re telling you:
Chart 1

- High Fertility Days: CD 15, 16, 17, 18, 20
- Peak Fertility Day: CD 19
- Ovulation Day: CD 20
(Ovulation is considered to be the day after your Peak Fertility. This is marked only after ovulation is confirmed) - Fertile Window: CD 15–20
- Ovulation Confirmed: CD 24
Chart 2
- High Fertility Days: CD 12, 13, 14, 15, 16, 18
- Peak Fertility Day: CD 17
- Fertile Window: CD 13–18
- Ovulation Confirmed: CD 22
Chart 3
- High Fertility Days: CD 9, 10, 11, 12, 14
- Peak Fertility Day: CD 13
- Fertile Window: CD 9–14
- Ovulation Day: Not applicable (Since there wasn’t a steady and consistent rise in PdG after Peak Fertility, ovulation was not confirmed)
Chart 4
This chart shows a gradual type of LH surge — where LH rises, stays elevated for a few days, and then tapers off.
In this pattern, Inito marks Peak Fertility from the point where LH begins its climb, which makes CD 13 the Peak Fertility day in this example.
- High Fertility Days: CD 10, 11, 12, 14
- Peak Fertility Day: CD 13
- Ovulation Day: CD 14
- Fertile Window: CD 9–14
- Ovulation Confirmed: CD 20
Chart 5
This chart shows a biphasic LH surge — where LH rises on one day, goes back down, and rises again on the third day, giving a characteristic M-shaped pattern.
In this pattern, Inito has marked 2 Peak Fertility days – CD 20 and CD 22 – since LH has risen from baseline levels on both days. However, the true LH surge is marked by a subsequent rise in PdG levels, which in this case was CD 22.
- High Fertility Days: CD 16, 17, 18, 19, 21, 23
- Peak Fertility Days: CD 20 and 22
- Ovulation Day: CD 23 (the true Peak Fertility day is the one that precedes a steady and consistent PdG rise)
- Ovulation Confirmed: CD 25
- Fertile Window: CD 18–23
Chart 6
This chart shows multiple LH surges — where LH rises more than twice in a cycle.
Inito marks a maximum of 2 Peak Fertility days, hence CD 9 and 11 are marked. However, you can see that LH rose again on CD 14, which was marked by a subsequent rise in PdG levels, making CD 14 the true Peak Fertility day.
- High Fertility Days: CD 7, 8, 10, 12
- Peak Fertility Days: CD 9 and 11 (True Peak Fertility was on CD 14)
- Ovulation Day: CD 15
- Ovulation Confirmed: CD 19
- Fertile Window: CD 10–15
Know more: False LH Surge Before The Real One


